Saturday, January 28, 2012

3 New stocks this week, and 1 out.

BACFirst up is Bank of America. After it reported earnings I decided I wanted this stock but finding an entry was hard. So I just decided on the 24th to make my entry and keep the trailing stop tight in case I was wrong and was going to be burned. One thing to take notice on this chart is the little blue dots under price. This is something I ‘m looking at that will give me a good trailing stop starting point in case I do not have a pivot low to build off of. Below is my risk numbers for BAC. .63% on total investment, that’s tight.

FNext is Ford. The earnings report on Ford hit Friday and it did not live up to expectation but overall it wasn’t that bad. But, sellers stepped in and drove price down well below my stop loss. I was forced to take a 3% profit and put Ford back in my watch list. I will be watching this stock closely next week because I want it back if it can reverse and create a new higher pivot low. I like Ford and I still think it is in the beginning of a long term uptrend.

GildNext up is GLID. I hate trying to find a entry point on stocks when they run like this. I missed the true entry which was December 27th – 29th and since that point nothing but uphill everyday. So what normally happens when I finally do pull the trigger on trends like this, is that I call the top and it reverses. I do not think I have gotten one of these right yet. With that knowledge, I should have just stepped aside, but instead I pulled the trigger Friday and put my stop loss order on what looked to me like the last resistance when it was broken. I have a .41% risk on entire portfolio and 3.36% risk on this one transaction. I feel pretty safe because of the small consolidation and breakout that I highlighted on the chart. Another thing that I know I shouldn’t do is buy right before earnings and GILD reports next Thursday 2/2/12. So if this transaction doesn’t pan out, who you gonna blame? Uh, me!!

SykLast is SYK. On a Weekly chart SYK is breakout right now and is going to give a buy signal Monday. On the daily chart I’m way behind the curve and should have bought this stock about the same time I should have GILD above. That’s ok, at least this time I’m buying after earnings and all I have to fear here is that price might give back some of the surge in price that happened the day of earning were reported. I waited one day after thinking there would be some profit taking, and there was, then on day two I was just looking for a little strength after the 10am point of the day. I pulled the trigger and set my stop loss order with a .3% overall risk and with a single transaction risk of 2.43%

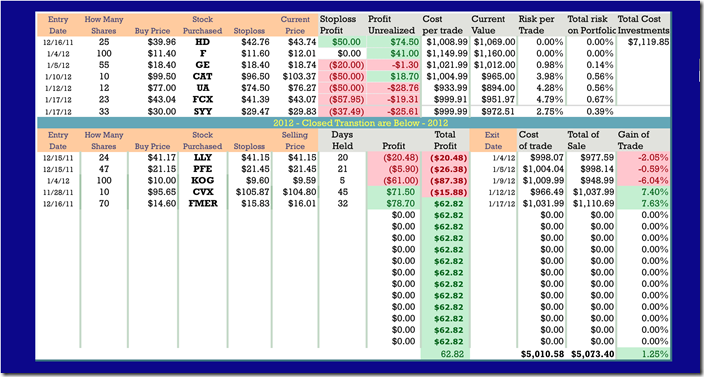
Below you will find my current status for the year and like I always say, if they will not show you their true progress, walk away because you know they blowing smoke up your………

image

Thursday, January 19, 2012

Bounced out of Under Armor

UAUnfortunately, I got bounced out of Under Armor because of a news article by Jefferies making a comment about fear that UA was not going to make or meet earnings expectation next week. So prior to the market opening, UA fell below my stop loss and executed just a bit lower than my risk point. You can read my original write below this post with the original chart and compare it to the bounced out chart. Sometimes you win and sometimes you lose. This time technicals lost to NEWS. I will keep UA on my radar but will not touch it again no matter what until after earnings.

image

image

The write below was from January 12th


UA_thumb1Last stock I want to talk about is Under Armor. I have been watching this stock for a long time and today I pulled the trigger and put it in my portfolio. UA at first glance appears to be in a down trend, but there are a lot of indicators telling a different story. On the Weekly chart not shown, the 10 and 30 day moving average never crossed indicating a sell. On the daily chart the most important signs is the higher pivot low and todays price closed above the last pivot high. So now we are guaranteed and higher pivot high somewhere down the road. Now if we supplement price indicators with our oscillators, we have several confirmation to help us decide to buy. The PSAR fired a buy the first day of the trading year. The CMO fired off on 1/9/12 and the MACD fired off 12/29/11 in December. The Stochastic fired on 1/4/12. So after todays break above the last high, I decided enough was enough and took a chance with UA. The risk for me on UA on a single transaction is 4.28%, but my total risk on the entire investment portfolio is just .68%. I think that is worth the risk.

Tuesday, January 17, 2012

Stock update and current moves.

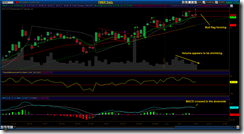
FMERWithin the first 1 minute of the open today I got bumped out of FMER for a 7.63% profit. I wasn’t real please with that, but a stop loss is a stop loss and it is suppose to take the emotion out of the game. Funny thing is I do not remember moving my stop loss from $15.83 to 16.01. The daily shown here, you can see a bull flag forming and price is bouncing on the bottom of the flag. I squeezed my stop loss just below that flag and got bounced. The ParabolicSar looks like tomorrow it will fire a sell also. The only other negative is that volume appears to be shrinking. Now if you look at the moving averages they are still good and still indicate a buy, but everything to me looks like it is going to roll over. So I took the profit and banked it. Is that wrong? Never wrong to take a profit the last time I checked. I will keep this in my list and if that bull flag pans out, I will repurchase the stock. The weekly chart, not shown, still looks strong and I expect this stock to actually stall then take off again.

One of the two stocks that I wrote up over the weekend did exactly what I wanted it to do this morning at the open, so my order was fired. I bought FCX @ $43.04 as soon as the bell rung. I wanted to buy it as it passed through $42.70, but it open up at $43.04 with a high of $43.29 and closed at $43.07. My stop loss was set immediately after it was purchased because it was part of my order and that was set at $41.39.

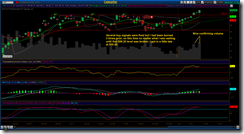
SYYSaturday December 31, 2011 I made mention of a few stocks that I was watching and one of those broke big today with price and volume. Along with that the MACD crossed over to the positive and if you look at price, it has been consolidating since 12/5/11. I made some markings on the daily chart to note the things that caught my attention. Unfortunately, stock price closed .17 cents below what I paid for it, but we got to give it time to pan out.

Brief update on my other positions. HD, Home depot still climbing but MACD crossed over and is looking weak. On the Weekly chart it still looks strong. My only fear is that volume appears to trailing off and it may fall fast at any moment. I will keep my stop loss tight on this one. Ford, F, on the Weekly chart is just getting started on this new up trend and I just hope that it will run a bit before it does any pullbacks. Daily it looks like it wants to pullback and rest a bit but it is just to early to tell. General Electric, GE is starting to rollover. I got a sell signal with the PAR and the MACD. It is possible that GE is forming a bull flag and is just resting for the next leg up, but only time will tell. GE is a watch if your outside looking in. Under Armor, UA, looks like it might not pan out for me. I just bought this position last week so it has no legs yet. I need price to hold above $75.06 in order to have any hope that this was not just a head fake.

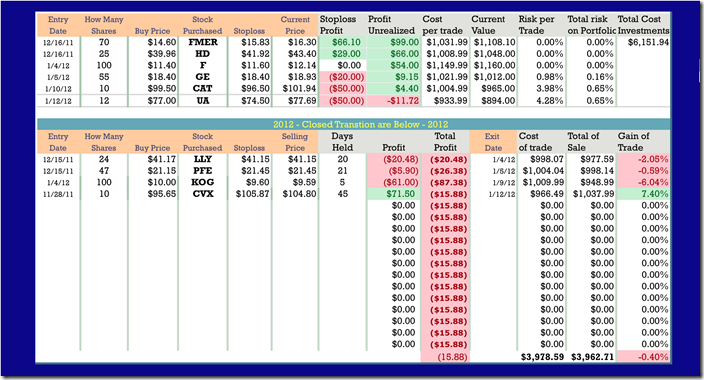
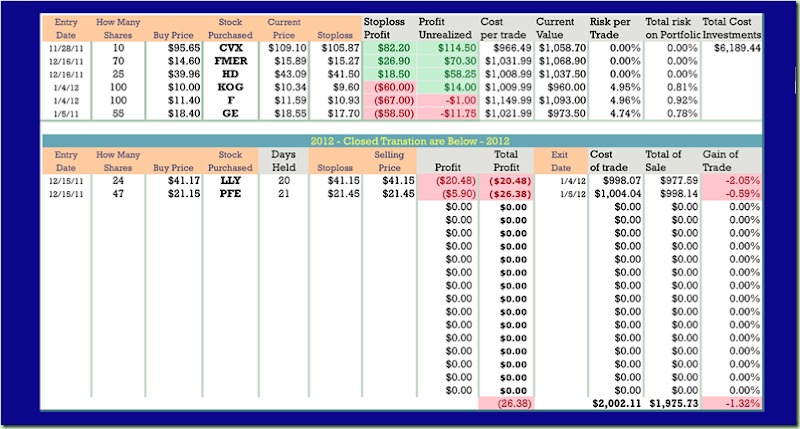
These are all the latest moves as of today and you can open the chart below to see every transaction risk and reward below.

image

Saturday, January 14, 2012

Stocks to watch for the January 17-20

First on my list is Bank of America, BAC.

BACweekly

The weekly chart is slow moving and normally late getting in and late getting out but it will eliminate the noise. Everything on this chart is screaming buy me right now but knowing that earnings will be reported1/19/2012 before the market opens will cause me to pause until BACThursday morning. Do not worry catching the initial surge up because this stock has the potential to run to $15. That would still be close to a 100% return. Take a quick look at the daily chart because that has a few notes on it, but basically it is still a wait and see. I would not chase this until the report.


FCXweekly

Freeport McMoran, FCX is turning the corner for a new long term uptrend on the weekly chart. A long series of lower pivot highs was broken just just week. The turn officially started October 3, 2011 so this new swing has been a work in progress and is not a knee jerk. We also have 2 higher pivot lows for support. The level that was finally broken was $41.22 so we are just a few days behind. Looking at the daily chartFCX we can use this to our advantage. We should wait to see if $41.22 holds, because Friday share price did turn down with the rest of the market. So we need price to do one of two things. Hold above $41.22 the drive through the last high of $42.69 and buy at $42.70 or above. Second we could watch price fall through $41.22, create a higher pivot low somewhere about $38 and then buy once that pivot low was created. You would not know price until the pivot was created. My guess would be between $38 and $41. FCX also pays a 2% dividend. Either this is a definite watch this week.


Thursday, January 12, 2012

Buy and Sell update.

CVXToday I got bounced out of CVX, Chevron after holding it for 45 days. That is a long time for me and I was hoping that it would be a long term hold, but things just didn’t work out. First, $110 has been a major point of resistance since March 28, 2011. Yes, that is a long time and CVX ran back up to that point this week and bounced lower. Not a good sign. Then today the company announced that they expect earnings this year to fall 21%, so down she went. My stop loss order failed to fire at the correct level because the news hit before the market opened, so I got a lower price, but that’s ok, I made a 7% profit. Now looking at it from a technical stand point, 4 definite sell signals were fired this morning, so no regrets here. My green uptrend line was violated. Parabolic SAR did a cross and fired a sell signal. MACD and Chande Momentum Oscillator also fired.

KOGKOG, Kodiak Oil & Gas I bought on 1/4/12 when it broke out above the Bull Flag. I set my stop loss just below my entry and got bounced out 1/9/12 for a 6% loss that hurt a bit. Today more damage was done in the stock in that price broke below the uptrend, PSAR fired a sell, Macd fired a sell on 1/9/12, and lastly the CMO is getting ready to cross below zero. One more important point is that price also broke below the last pivot low and with this many things screaming sell, I guess it was time to just watch this stock for another point of entry. If you own it, I would consider highly taking your profits and wait for another entry.

GEGE is starting to stall and I moved my stop loss in tight so I would not take a big loss in the position. The PSAR fired a sell two days ago and now the MACD fired a pink down arrow sell and the MACD lines are squeezed tightly together. The uptrend is still holding and price has not violated anything yet, but even price looks to be stalling. The CMO is starting to turn down and this to brings in concern. The only positive that I can take away from this chart is that both moving averages are still climbing. I do not think it will take much for this to fall, but as long as the S&P 500 continues to climb, GE will likely continue to climb. Just be careful here and do not give back to much profit.

CATTwo days ago Caterpillar finally busted through $98.20 and it did it with volume to confirm it. I have been burned a few times with Cat, so I was waiting for that level to be broken. I believe that the measured move from the channel breakout if I did it correctly should push CAT to $110 before it slows to much. The next major level of resistance will be $112.


UALast stock I want to talk about is Under Armor. I have been watching this stock for a long time and today I pulled the trigger and put it in my portfolio. UA at first glance appears to be in a down trend, but there are a lot of indicators telling a different story. On the Weekly chart not shown, the 10 and 30 day moving average never crossed indicating a sell. On the daily chart the most important signs is the higher pivot low and todays price closed above the last pivot high. So now we are guaranteed and higher pivot high somewhere down the road. Now if we supplement price indicators with our oscillators, we have several confirmation to help us decide to buy. The PSAR fired a buy the first day of the trading year. The CMO fired off on 1/9/12 and the MACD fired off 12/29/11 in December. The Stochastic fired on 1/4/12. So after todays break above the last high, I decided enough was enough and took a chance with UA. The risk for me on UA on a single transaction is 4.28%, but my total risk on the entire investment portfolio is just .68%. I think that is worth the risk.

image

Thursday, January 5, 2012

Sold PFE–Bought GE

Got popped out of Pfizer for a small loss and re-invested those funds into GE. Yesterday got popped out Lily and re-invested in Ford. I also bought Kodiak Oil when it broke out of the Bull Flag that it had formed.

image

Sunday, January 1, 2012

Some passed calls and how they are doing today.

Monday’s picks from December 17th, FMER, HD, and MRK, are still working even though all three are in Bull Flags and under a closer watch. FMER has gone from $14.59 to $15.13 a 3.7% gain. HD has gone from $40.42 to $42.04 a 4% gain. Lastly the only one that I couldn’t buy at the time because I had no cash, was MRK. MRK has moved from $36.25 to $37.70 a 4% gain. All 3 stocks are still working, but are in Bull Flags with stop loss orders on all except MRK which I do not own.

The two post prior to this post there are 13 stocks in Bull Flags ready to go in one direction or the other. If the break up, then they are buys. If they consolidate and stay in the flag, then we do nothing and watch. If they break down, then we have the option to do nothing or short the stock. But until something happens, we do nothing and just watch.

Part 2 of what I’m watching.

I’ve got 16 stocks that I watch closely and most are flagging and worth the watch. Below is Home Depot and it has been on the run since August 9th and there is a lot of chat on the Internet that it is going fall and fall hard. They are all calling the top and shorting the stock. I do not call tops or bottoms because I follow the trends. So right now Home Depot is in a very distinct Bull Flag and if it breaks to the upside, play it. If it stays in the Bull Flag and consolidates or falls from the flag then do nothing or short it when it falls through.

HD

Kodiak Oil is also in the early stages of a Bull Flag and like Home Depot, has been in a very long run without much of a consolidation. The climb angle here is much sharper and looks scary to me. But if it breaks out of this Bull Flag and continues higher, play it.

KOG

The next 6 stocks below are all in a Bull Flag and all deserve to be watched for a breakout. Just remember, do guess or bet on direction, wait for it. Always place a stop loss order below the break out point, a pivot low, or a percentage below but never ever just let it go. Nothing like trying to figuring on the fly during panic selling when or where to sell. Most of us can’t handle that kind of pressure with real money.

LLYMRKPFEPNCRAISYY