
Still has not broken the downtrend line. Price is still below both 50 day moving averages, EXP & Simple. Using the the Count Back Line approach, price would need to close above $6.24 before I would buy ATML.
Saturday, September 1, 2012

Friday, August 31, 2012
Best month YTD !!
It's not often when I'm dealing with buying and selling indiviual stocks that I can sing something good is happening, but August was my best month of the year. My liitle account is not worth much at the moment, but it is growing monthly because I'm feeding it new monies. When I paid cash for that car last March, it kind of drained my trading funds. This month I made $400 to put in my pocket which is good by my standards. I know the guys who do this for a living and trade big bucks, this is chump change, but I do this now educating myself for the next phase in my life when I retire. So yearly, I'm down $849 which is a little depressing, but nothing I cannot overcome. I'm self taught via books, internet, and following the reading of some traders online.
One more note. I may be down year to date trading individual stocks, but my retirement account is up over 13% for the year. I monitor that as close if not closer than my stock trading. Yes, I move money in an out of different funds throughout the year and this year I have made 8 moves.
My current stock positions are DMND, FBHS, LULU, MDAS, and PLCM. I'm up on 2 out of 5 currently and the only back breaker at the moment is DMND. I'm currently down 5.8% if I was to close this position right now. My stoploss on the stock is $18.50 and current price is $19.67. Overall the current movement in the stock is sideways and still meets all my requirements, so I will continue to hold this. PLCM looks a little shakey at this time, but I still like it. All other positions look good and I will hold them all over the weekend.
No trading Monday in the US because of Labor Day Holiday, so Tuesday we get back at it. My current watch list and holdings are below.

Thursday, August 30, 2012
Bad day in the market and I'll show you mine.


What I like or love about most people that trade stocks is that they always tell you how much they are making or how great their last trade was but never show you. If you really want to cut to the chase with these hero's, ask them one simple question and that normally ends the conversation. Can I see your profit and loss statement year to date? Most will give you a deer in the headlight look to which you just smile and walk away. Without that data, it's just words.
Today the stock market was down .8 to 1 % on most indexes. Since those indexes are made up of several stocks, it doesn't seem so bad. So when you own individual stocks, it sometimes can get brutal. The 5 stocks that I show above are all owned by me and they were all down. The range was .5 to 4.3%. Ouch! I really only had one stock get pounded into the ground and that was DMND down 4.3%. The rest were 1.5% or less.
As you click those stocks above you will see a green dotted line which represents my entry price and then a solid red line with a flag showing my trailing stop. None were hit today and I can only hope that this is just a temporary selloff that will rebound tomorrow. I was just starting to digout of my last hole, so I would like to keep that going. The one thing that has me concerned is that the Dow30 and Transportation are starting to tank and that could be a sign of things to come in the very near future. Oh, we also have Uncle Ben speaking tomorrow. I expect that he'll do nothing and I expect that we might have another selloff because of that.
Below is a chart of the S&P500 and it is starting to show signs a warning is warranted. I use a Count Back Line to help me take the emotion out selling stocks because my discipline is not always the best. But when it comes to my retirment money, I like to stay on top of things. You will see below that we are approaching my first warning level and that is the Count Back Line in Red. Price is stll above both the Exponential and Simple moving averages and both averages are still rising. Lastly, price is also above the current green uptrend line. I would have to see price close below the 50's and break the the uptrend line before I would pull my retirement money out of this current market uptrend.

Wednesday, August 29, 2012
APKT Breakout
APKT is sqwaking buy me today breakout out of my Count Back Line, Downtrend line, and above the 50 day moving average. I'm out of funds and I do not want to sell my current positons. :(

Tuesday, August 28, 2012
Bought a couple more today.
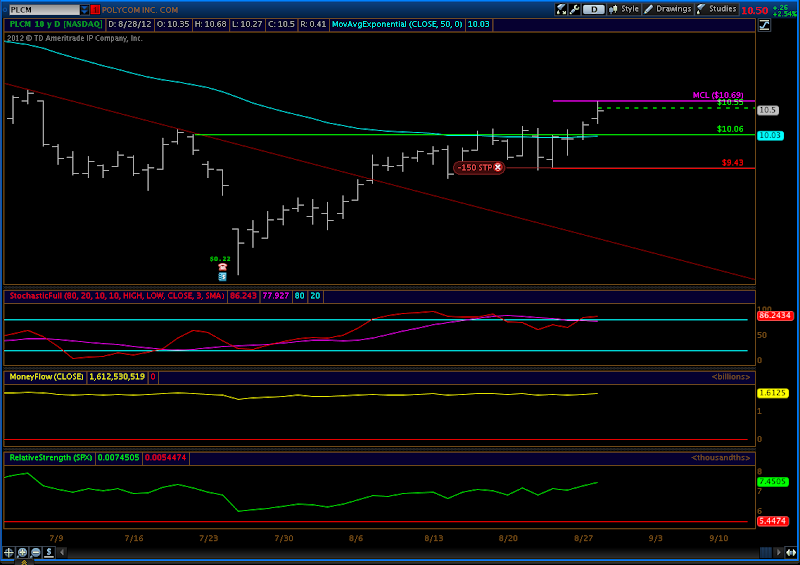
Today I purchased a couple more stocks and that pretty much taps me out until I close a position. Below you will find 2 charts with all the details on the charts. Once again, I found both of these stock ideas from following the guys at IBankCoin.com. Have all intentions of joining their page so I can expand my horizons.

Took a profit and bought 2
Ok, I totally chickened out of CTRP and put it on my radar to watch for now. I made a grand total of $14, but it just look suspicious and I felt better with my capitol back in my account. If it tanks then I was right and justified and if I'm wrong, it is money I never had, so once again none of my money lost.
Today I did as I said I would do and re-entered DMND. I also bought LULU. On the charts below you will see a green dotted line showing my entry price and it lines up with the day purchased. All the other lines have notes and are self explained.


Saturday, August 25, 2012
Last one till next week.

Ok, this one I was actually waiting for the breakout and it was on ChessNwine watch list. I do not trade for a living and like you hear some golfers say, I'm a hack. But with that said, I feel if I actually gave myself the time to do this once retired, I could do it fairly well. I manage not to lose to much money year over year and for the most part tread water. That is not my goal. My goal is to make money to entertain my self and mind. I really do not care if I'm rich, but like most things that I do, I want to be good at it.
I wanted to hang around the house and see what this stock was going to do, but I had some errands, like changing the oil that just had to be done. I was 2.5 hours behind the breakout on this one and I bought near the high of the day. I guess this is better than 2 days behind, as I normally do. :) The 50 day ma's are rising and we have a prior breakout out af a long consolidation along with a breakout of current consolidation. What kills me is what I show you next.

Above is the 10 minute chart. I moved some key information from the daily chat so you could closely see breakout, purchase price and then the end of day selling. Kind of a disappointment to see that right after pulling the trigger, but my stoploss is set just below the last consolidation channel.
Subscribe to:
Posts (Atom)